雨滴粒径分布の解析・可視化
はじめに
雨滴粒径分布は、雲・降水過程を特徴づける基礎的かつ重要なものである。その形には複数のピークを持つこと(Multi-peak drop size distribution) や、数値モデルでの取り扱い (Spectral Bin Microphysics Model)、レーダー変数との関係 (Self-consistency Principle、粒径分布とレーダー変数、粒径分布パラメータのレーダー変数による推定) からも分かる通り、幅広く利用・応用されている。雨滴粒径分布の観測は主として地上で行われてきており、最近ではレーザーシートによるメンテナンスフリーな観測も可能となってきている。そこで、本稿では地上で観測された雨滴粒径分布の解析とその可視化について述べる。
データ
下記のようなフォーマットでデータを用意する。今回は、下記の内容を testdata.mis という名前で保存し、利用する。
01:89.691
11:3693
20:09:20:10
21:11.18.2024
90:0.00000000e+00;0.00000000e+00;2.06854339e+02;2.13144060e+03;4.62869760e+03;4.57738882e+03;3.27162570e+03;2.64969391e+03;2.00687436e+03;1.21636766e+03;1.04742980e+03;7.53899922e+02;6.04884905e+02;4.23819184e+02;3.03061391e+02;1.49220270e+02;4.49463544e+01;1.14963409e+01;1.54904461e+00;0.00000000e+00;0.00000000e+00;0.00000000e+00;0.00000000e+00;0.00000000e+00;0.00000000e+00;0.00000000e+00;0.00000000e+00;0.00000000e+00;0.00000000e+00;0.00000000e+00;0.00000000e+00;0.00000000e+00;
93:0;0;0;0;0;0;0;0;0;0;0;0;0;0;0;0;0;0;0;0;0;0;0;0;0;0;0;0;0;0;0;0;0;0;0;0;0;0;0;0;0;0;0;0;0;0;0;0;0;0;0;0;0;0;0;0;0;0;0;0;0;0;0;0;0;0;0;0;1;0;0;1;0;0;0;0;0;0;0;0;0;0;0;0;0;0;0;0;0;0;0;0;0;0;0;0;0;0;0;4;0;0;0;0;0;0;0;0;0;0;0;0;0;0;0;0;0;0;0;0;0;0;0;0;0;0;0;0;0;0;0;3;0;0;0;0;0;0;0;0;0;0;0;0;0;0;0;0;0;0;0;0;0;0;0;0;0;0;0;0;0;0;0;1;2;0;0;0;0;0;0;0;0;0;0;0;0;0;0;0;0;0;0;0;0;0;0;0;0;0;0;0;0;0;0;3;2;1;0;0;0;0;0;0;0;0;0;0;0;0;0;0;0;0;0;0;0;0;0;0;0;0;0;0;0;0;1;2;1;0;0;0;0;0;0;0;0;0;0;0;0;0;0;0;0;0;0;0;0;0;0;0;0;0;0;0;0;0;1;1;0;2;1;0;0;0;0;0;0;0;0;0;0;0;0;0;0;0;0;0;0;0;0;0;0;0;0;0;0;0;0;2;4;2;1;0;1;0;0;0;0;0;0;0;0;0;0;0;0;0;0;0;0;0;0;0;0;0;0;0;0;0;2;12;9;3;2;1;0;0;0;0;0;0;0;0;0;0;0;0;0;0;0;0;0;0;0;0;0;0;0;0;0;0;1;4;11;6;3;1;0;0;0;0;0;0;0;0;0;0;0;0;0;0;0;0;0;0;0;0;0;0;0;0;0;0;1;10;24;14;6;0;1;0;0;0;0;0;0;0;0;0;0;0;0;0;0;0;0;0;0;0;0;0;0;0;0;0;2;14;27;16;6;4;0;0;0;0;0;0;0;0;0;0;0;0;0;0;0;0;0;0;0;0;0;0;0;0;0;0;2;14;40;12;2;3;2;0;0;0;0;0;0;0;0;0;0;0;0;0;0;0;0;0;0;0;0;0;0;0;0;0;0;22;95;78;19;4;1;1;0;2;0;0;0;0;0;0;0;0;0;0;0;0;0;0;0;0;0;0;0;0;0;0;1;18;84;107;54;12;4;0;3;1;1;0;0;0;0;0;0;0;0;0;0;0;0;0;0;0;0;0;0;0;0;0;0;8;59;113;94;40;15;7;5;2;1;0;0;0;0;0;0;0;0;0;0;0;0;0;0;0;0;0;0;0;0;0;0;0;22;62;87;87;42;16;6;1;1;1;0;0;0;0;0;0;0;0;0;0;0;0;0;0;0;0;0;0;0;0;0;0;0;55;71;100;61;37;37;6;4;0;0;0;0;0;0;0;0;0;0;0;0;0;0;0;0;0;0;0;0;0;0;0;0;0;51;112;174;118;215;90;10;2;0;0;0;0;0;0;0;0;0;0;0;0;0;0;0;0;0;0;0;0;0;0;0;0;5;3;5;16;88;152;111;29;5;4;0;0;0;0;0;0;0;0;0;0;0;0;0;0;0;0;0;0;0;0;0;0;0;0;0;1;6;23;104;120;53;14;1;0;0;0;0;0;0;0;0;0;0;0;0;0;0;0;0;0;0;0;0;0;0;0;0;0;0;2;18;34;74;66;6;2;0;0;0;0;0;0;0;0;0;0;0;0;0;0;0;0;0;0;0;0;0;0;0;0;0;0;0;3;13;59;32;3;0;0;0;0;0;0;0;0;0;0;0;0;0;0;0;0;0;0;0;0;0;0;0;0;0;0;0;0;0;10;9;8;1;0;0;0;0;0;0;0;0;0;0;0;0;0;0;0;0;0;0;0;0;0;0;0;0;0;0;0;0;0;1;0;1;0;0;0;0;0;0;0;0;0;0;0;0;0;0;0;0;0;0;0;0;0;0;0;0;0;0;0;0;0;0;0;0;0;0;0;0;0;0;0;0;0;0;0;0;0;0;0;0;0;0;0;0;0;0;0;0;0;0;0;0;0;0;0;0;0;0;0;0;0;0;0;0;0;0;0;0;0;0;0;0;0;0;0;0;0;0;0;0;0;0;0;0;0;0;0;0;0;0;0;0;0;0;0;0;0;0;0;0;0;0;0;0;0;0;0;0;0;0;0;0;0;0;0;0;0;0;0;0;0;0;0;0;0;0;0;0;0;0;0;0;0;0;0;0;0;0;0;0;0;0;0;0;0;0;0;0;0;0;0;0;0;0;0;0;0;0;0;0;0;0;0;0;0
ソースコード
上記のデータを読み込み、可視化するソースコードを以下に示す。最低限、Python 組み込みライブラリの os, io, datetime, dateutil、外部ライブラリとして pandas, numpy, matplotlib があれば良い。ソースコードの一部は、PyDSD を参考にした。
import os
import io
import pandas as pd
import numpy as np
from datetime import datetime, timedelta
from dateutil import parser, relativedelta
import matplotlib
import matplotlib.pyplot as plt
import matplotlib.dates as mdates
import warnings
warnings.filterwarnings('ignore')
%matplotlib inline


# Pre-process for reading original data
rain_rate = []
num_particles = []
_base_time = []
nd = []
vd = []
raw = []
with io.open('testdata.mis', encoding='utf-8') as f:
    for line in f:
        line = line.rstrip("\n\r;")
        code = line.split(":")[0]
        if code == "01":    # Rain Rate
            rain_rate.append(float(line.split(":")[1]))
        elif code == "11":  # Num Particles
            num_particles.append(int(line.split(":")[1]))
        elif code == "21":  # Date string
            date_tuple = line.split(":")[1].split(".")
            _base_time.append(
                datetime(
                    year=int(date_tuple[2]),
                    month=int(date_tuple[1]),
                    day=int(date_tuple[0]),
                )
            )
        elif code == "90":  # Nd
            nd.append(np.power(10, list(map(float, line.split(":")[1].split(";")))))
        elif code == "93":  # md
            raw.append(list(map(int, line.split(":")[1].split(";"))))

# Constants
diameter = np.array([0.06,0.19,0.32,0.45,0.58,
                     0.71,0.84,0.96,1.09,1.22,
                     1.42,1.67,1.93,2.19,2.45,
                     2.83,3.35,3.86,4.38,4.89,
                     5.66,6.7,7.72,8.76,9.78,
                     11.33,13.39,15.45,17.51,19.57,
                     22.15,25.24])
vel    = np.array([0.050,0.150,0.250,0.350,0.450,
                   0.550,0.650,0.750,0.850,0.950,
                   1.100,1.300,1.500,1.700,1.900,
                   2.200,2.600,3.000,3.400,3.800,
                   4.400,5.200,6.000,6.800,7.600,
                   8.800,10.400,12.000,13.600,15.200,
                   17.600,20.800])
spread = np.array([0.129,0.129,0.129,0.129,0.129,0.129,
                   0.129,0.129,0.129,0.129,0.257,0.257,
                   0.257,0.257,0.257,0.515,0.515,0.515,
                   0.515,0.515,1.030,1.030,1.030,1.030,
                   1.030,2.060,2.060,2.060,2.060,2.060,
                   3.090,3.090])


# Plot V-D histogram
plt.pcolormesh(np.reshape(raw, (32,32)), cmap='Blues')
plt.title('Diameter-Fall velocity')
plt.xlabel('Diameter in laser sheet pixels (mm)')
plt.ylabel('Fall velocity in laser sheet pixels (m s$^{-1}$)')
plt.xticks(np.arange(0,32,4), diameter[::4])
plt.yticks(np.arange(0,32,4), vel[::4])
plt.colorbar(extend='both', label='Number of counts')
plt.show()


# Plot drop size distribution
for k in range(len(raw)):
    raw_data = np.reshape(raw[k], (32,32))
    ND = np.array([0.0,0.0,0.0,0.0,0.0,0.0,0.0,0.0,0.0,0.0,0.0,0.0,0.0,0.0,0.0,0.0,0.0,0.0,0.0,0.0,0.0,0.0,0.0,0.0,0.0,0.0,0.0,0.0,0.0,0.0,0.0,0.0])
    for j in range(32): # V loop
        for i in range(32): # D loop
            ND[j] += raw_data[i][j] / (vel[i] * (0.18 * 0.03) * 60.0)  # md / (Vi * sheet area * sampling time)
        ND[j] /= spread[j]  # md / (Vi * sheet area * sampling time * delta Di)
    plt.plot(diameter, np.ma.masked_where(ND < 0.1, ND), linestyle=':')
plt.xlabel('Diameter (mm)')
plt.ylabel('$N(D)$ (mm$^{-1}$ m$^{-3}$)')
plt.yscale('log')
plt.ylim(1,10000)
plt.xlim(0,5)
plt.grid()
plt.show()
結果
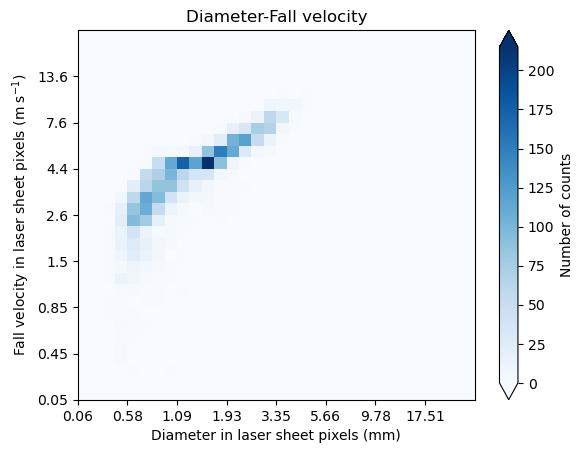
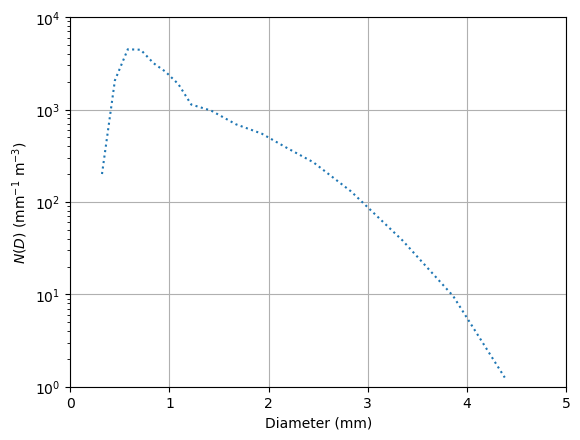
上記ソースコードで出力されたものが下記。一枚目は横軸に粒径・縦軸に落下速度とした場合の二次元ヒストグラム、二枚目は横軸に粒径・縦軸に粒径毎の頻度としたいわゆる粒径分布である。

頻度の高い部分は Atlas et al. (1973) で調べられた粒径と落下速度の曲線に概ね沿うため、今回の事例では雨滴が観測されていると判断することが出来る。

雨滴粒径分布は、0.7 mm 付近にピークを持ち、McFarquhar (2004) 或いは Straub (2010) で得られた stationary distribution に近い形をしていることが分かる。
降水強度を粒径分布から算出する場合には、一枚目の図で示したように、観測されたデータの種類を特定しておく必要がある。同様に、粒径分布の描画・解析時にも、どの粒子が観測されており、その粒子のどのような特徴が得られているかを確認する必要がある。より発展的な解析は、こちら を参考にされたい。
おわりに
今回は雨滴粒径分布の解析と可視化について、具体例を示しつつ紹介した。
参考文献
- Atlas, D., R. C. Srivastava, and R. S. Sekhon, 1973: Doppler radar characteristics of precipitation at vertical incidence. Rev. Geophys., 11, 1–35.
- McFarquhar, G. M., 2004: A new representation of collision-induced breakup of raindrops and its implications for the shapes of raindrop size distributions. J. Atmos. Sci., 61, 777–794.
- Straub, W., K. D. Beheng, A. Seifert, J. Schlottke, and B. Weigand, 2010: Numerical investigation of collisioninduced breakup of raindrops. Part II: Parameterizations of coalescence efficiencies and fragment size distributions, J. Atmos. Sci., 67, 576–588.
更新履歴
- 2024-11-22: 初稿
Miscellaneous — Nov 22, 2024
Made with ❤ and at Japan.