二重偏波レーダー変数の算出とその補正
はじめに
Signal Processing Methods では、気象レーダーの観測結果から得られるレーダー変数推定時にバイアスとなりうる要素やレーダー変数の算出・補正について概観した。その後、二重偏波要素の特徴にて radlib を用いて具体例を示した。降水強度推定については、偏波間位相差変化率 () の推定アルゴリズムについて概観し (降水強度のKDP推定アルゴリズムについて) 、主として偏波間位相差 () の観測値を活かすようなフィルター・平滑化処理を行うことが重要であることを認識した。サイト毎に得られるレーダー変数の算出やその補正については二重偏波要素の特徴で言及したものの、それらの具体的な算出・補正方法については触れていなかった。そこで、本稿では降水強度算出に関連するレーダー変数の算出方法とレーダー変数推定時にバイアスとなりうる要素に対する補正方法について具体例を示す。それらを以て二重偏波レーダー変数の算出・補正について理解を深める。
用語
- : 水平偏波反射強度 (dBZ)
- : 降雨減衰補正済の反射強度 (dBZ)
- : 偏波間相関係数
-
: 偏波間位相差 (degree)
- 本稿では平滑化処理済のデータを扱う
- : 偏波間位相差変化率 (degree/km)
- Attenuation: (降雨または大気による) 減衰 (dB)
- 本稿では主に降雨減衰に対する補正を扱う
- : Z-R 関係を用いて降雨減衰補正済の水平偏波反射強度から求めた降水強度 (mm/hr)
- : を用いて求めた降水強度 (mm/hr)
実施環境
レーダー変数の算出・補正
反射強度の降雨減衰補正
Signal Processing Methods で挙げたレーダー変数推定時にバイアスとなりうる要素のうち、attenuation in atmospheric gases and precipitation (大気減衰・降雨減衰) を取り扱う。大気減衰は主に標準大気を仮定するため、多くの場合一定値が用いられ、補正は単純となる。一方、降雨減衰はその減衰量をどのように求めるかによって考え方や算出手法が異なるようだ。ここでは、Z-PHI 法 (Gu et al. 2011) と呼ばれる降雨減衰補正について述べる。Z-PHI 法では、ざっくり言うと反射強度 の減衰量が に比例することを仮定し、降雨減衰量を求める。Py-ART では、calculate_attenuation という関数を用いる。このページを参考にして、下記のようなスクリプトを用意。データはこちら。
import matplotlib.pyplot as plt
from matplotlib.colors import ListedColormap, BoundaryNorm
import pyart

RADAR_NAME = 'sgpcsaprsurcmacI7.c0.20110520.095101.nc'

# read in the data
radar = pyart.io.read_cfradial(RADAR_NAME)

# remove existing corrections
radar.fields.pop('specific_attenuation')
radar.fields.pop('corrected_reflectivity_horizontal')

# perform attenuation correction
spec_at, cor_z = pyart.correct.calculate_attenuation(
    radar, 0, refl_field='reflectivity_horizontal',
    ncp_field='norm_coherent_power', rhv_field='copol_coeff',
    phidp_field='proc_dp_phase_shift')
radar.add_field('specific_attenuation', spec_at)
radar.add_field('corrected_reflectivity_horizontal', cor_z)

# create colormap
cmap = ListedColormap(["#0FF", "#07C", "#036", "#00F", "#097", "#0A4", "#0D1", "#4F1", "#7C0", "#FF0", "#F80", "#F8F", "#F4A", "#F00"])
bounds = [23, 28, 33, 37, 40, 42, 45, 47, 49, 50, 51, 52, 53]
norm = BoundaryNorm(bounds, cmap.N)

# create the plot
fig = plt.figure(figsize=(5, 10))
ax1 = fig.add_subplot(311)
ax1.set_aspect('equal', 'box')
display = pyart.graph.RadarDisplay(radar)
display.plot('reflectivity_horizontal', 0, ax=ax1,
             vmin=min(bounds), vmax=max(bounds), cmap=cmap, norm=norm, ticks=bounds,
             colorbar_label='', title='Raw Reflectivity', axislabels=('','North South distance from radar (km)'))

ax2 = fig.add_subplot(312)
ax2.set_aspect('equal', 'box')
display.plot('specific_attenuation', 0, ax=ax2, vmin=0, vmax=1.0,
             colorbar_label='', title='Specific Attenuation', axislabels=('','North South distance from radar (km)'))

ax3 = fig.add_subplot(313)
ax3.set_aspect('equal', 'box')
display = pyart.graph.RadarDisplay(radar)
display.plot('corrected_reflectivity_horizontal', 0, ax=ax3,
             vmin=min(bounds), vmax=max(bounds), cmap=cmap, norm=norm, ticks=bounds,
             colorbar_label='', title='Corrected Reflectivity')

plt.suptitle('Attenuation correction using Py-ART', fontsize=16)
plt.show()
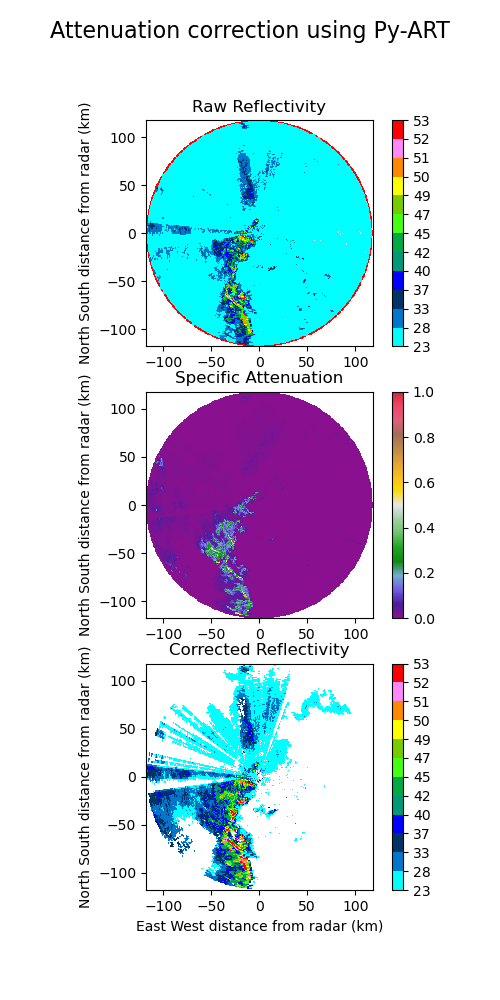
図は、上から降雨減衰補正前の反射強度 (dBZ)、降雨減衰量 (dB)、降雨減衰補正後の反射強度 (dBZ) をそれぞれ示す。
サンプルデータは C バンドのようで、中央図で値が大きい部分で水平偏波反射強度の減衰が生じている。上図と下図を比べると、上図では下図で減衰している部分が補正された状態で計算されている。加えて、の足切り処理も施されており、一定値以下の反射強度は無効値となっている。このようにから降雨による減衰量を推定することが出来る。では、はどのように算出されているのだろうか。次節でその具体を見てみる。

算出
降水強度のKDP推定アルゴリズムについてで述べたように、 の算出は とセットで行われることが多い。ただ、 から を算出する際に用いられる式は同じであり、 で与えられる (Rauber and Nesbitt, 2018)。ここで、dr は ray 方向の gate 幅。計算する場合は有限差分として、ある gate と一つ前の gate との 差分を gate 幅で割る。計算部分は KDP推定アルゴリズムの比較を参照することにして省略し、今回は計算済みのものを用いる。import matplotlib.pyplot as plt
from matplotlib.colors import ListedColormap, BoundaryNorm
import pyart
RADAR_NAME = 'data/sgpcsaprsurcmacI7.c0.20110520.095101.nc'
# read in the data
radar = pyart.io.read_cfradial(RADAR_NAME)
# create the plot
fig = plt.figure(figsize=(5, 10))
ax1 = fig.add_subplot(311)
ax1.set_aspect('equal', 'box')
display = pyart.graph.RadarDisplay(radar)
display.plot('proc_dp_phase_shift', 0, ax=ax1, cmap="viridis",
colorbar_label='', axislabels=('','North South distance from radar (km)'))
ax2 = fig.add_subplot(312)
ax2.set_aspect('equal', 'box')
display.plot('recalculated_diff_phase', 0, ax=ax2, vmin=0, vmax=5, cmap="viridis",
colorbar_label='', title='Specific differential phase', axislabels=('','North South distance from radar (km)'))
ax3 = fig.add_subplot(313)
display = pyart.graph.RadarDisplay(radar)
display.plot_ray('proc_dp_phase_shift', 225, format_str='b-',
axislabels_flag=False, title='Elevation: 0.8 Azimuth: 225', ax=ax3)
ax3.set_ylim(0, 300)
ax3.set_ylabel('Differential phase shift (degrees)')
ax3.set_xlabel('Range (km)')
ax4 = ax3.twinx()
display.plot_ray('recalculated_diff_phase', 225, format_str='g-',
axislabels_flag=False, title_flag=False, ax=ax4)
ax4.set_ylim(-1, 7)
ax4.set_ylabel('Specific differential phase (degree/km)')
ax3.legend(display.plots, ["PHIDP", "KDP"], loc='upper left')
plt.suptitle('PHIDP and KDP', fontsize=16)
plt.show()図は、上から (degree)、 (degree/km)、仰角 225 度の range 方向の と の値をそれぞれ示す。上図と中央図とを見比べると、 の位相が 50〜350 degree に大きく変化している部分で、値の大きい が計算されている。方位角 225 度のみ取り出し、レーダーの中心から range 方向の値の変化を見てみる (下図) と、確かに の勾配と の値の変化とが一致している。値の変化が一致しているのは分かるけれども、 の算出が適切かどうか判断する術は無いだろうか。次節でその一例を示す。

逆算
は、定義式から分かるように積分すると数学的には になる。ただし、 推定時に にフィルターまたは平滑化処理をしているため、完全一致しない。観測された と 推定後の値がどの程度一致しているかについては、 に値を揃えたほうが分かりやすいようだ。ということで、 の逆算は で得る。ここで、dr は ray 方向の gate 幅、rmin rmax はそれぞれ ray 方向の初めの gate 位置・終端 gate 位置。import numpy as np
import matplotlib.pyplot as plt
from matplotlib.colors import ListedColormap, BoundaryNorm
import pyart
from pyart.config import get_field_name, get_metadata
RADAR_NAME = 'data/sgpcsaprsurcmacI7.c0.20110520.095101.nc'
# read in the data
radar = pyart.io.read_cfradial(RADAR_NAME)
# reconstract PHIDP from KDP
dr = np.diff(radar.range['data'], n=1)
drm = dr/1000.
pdp_field = get_field_name('differential_phase')
pdp_o = radar.fields['proc_dp_phase_shift']['data']
nrays, nbins = np.shape(pdp_o)
rcpdp = np.ma.zeros((nrays, nbins))
kdp_field = radar.fields['recalculated_diff_phase']['data'].copy()
for ray in range(nrays):
kdp_ray = kdp_field[ray, :-1]
rcpdp[ray, :-1] = np.ma.cumsum(kdp_ray)*2.*drm
rcpdp_dict = get_metadata(pdp_field)
rcpdp_dict['data'] = rcpdp
radar.add_field('reconstrated_diff_phase', rcpdp_dict)
# create the plot
fig = plt.figure(figsize=(6, 5))
ax = fig.add_subplot(111)
display = pyart.graph.RadarDisplay(radar)
display.plot_ray('proc_dp_phase_shift', 225, format_str='b-',
axislabels_flag=False, ax=ax)
display.plot_ray('reconstrated_diff_phase', 225, format_str='g-',
axislabels_flag=False, title_flag=False, ax=ax)
ax.set_ylim(0, 300)
ax.set_ylabel('Differential phase shift (degrees)')
ax.set_xlabel('Range (km)')
ax.legend(display.plots, ["PHIDP", "Reconstracted PHIDP"], loc='upper left')
plt.show()図は、仰角 225 度の range 方向の の値を示す。青実線は元の 、緑実線は を range 方向に積分して に直したもの。青実線と緑実線とがほぼ一致しており、計算された は元の によく追従出来ている。

ここまでで、減衰補正済みの反射強度と高精度な の準備が出来た。次は、これらを用いた降水強度推定について述べる。
算出
Z-R 関係を用いた降水強度算出は、単偏波の場合に広く用いられてきた手法である。日本では主に (eq. 10.13: Ryzhkov and Zrnic, 2019) が用いられている。二重偏波の場合は、反射強度の降雨に対する減衰補正が可能。今回は、降雨減衰補正済の反射強度を用いた。計算には est_rain_rate_z 関数を用いた。
を用いた降水強度算出は、最近になって優位性が確立されてきたようだ (Adachi et al. 2015)。日本では が用いられている模様 (table 10.3: Ryzhkov and Zrnic, 2019)。計算には est_rain_rate_kdp 関数を用いた。import matplotlib.pyplot as plt
from matplotlib.colors import ListedColormap, BoundaryNorm
import pyart
RADAR_NAME = 'data/sgpcsaprsurcmacI7.c0.20110520.095101.nc'
# read in the data
radar = pyart.io.read_cfradial(RADAR_NAME)
# remove existing corrections
radar.fields.pop('specific_attenuation')
radar.fields.pop('corrected_reflectivity_horizontal')
# perform attenuation correction
spec_at, cor_z = pyart.correct.calculate_attenuation(
radar, 0, refl_field='reflectivity_horizontal',
ncp_field='norm_coherent_power', rhv_field='copol_coeff',
phidp_field='proc_dp_phase_shift')
radar.add_field('specific_attenuation', spec_at)
radar.add_field('corrected_reflectivity_horizontal', cor_z)
# calculate R(Zc) R(KDP)
rzc = pyart.retrieve.est_rain_rate_z(radar, alpha=0.005, beta=0.625, refl_field='corrected_reflectivity_horizontal')
rkdp = pyart.retrieve.est_rain_rate_z(radar, alpha=29, beta=0.85, kdp_field='recalculated_diff_phase')
radar.add_field('RZC', rzc)
radar.add_field('RKDP', rkdp)
# create colormap
cmap = ListedColormap(["#0FF", "#07C", "#036", "#00F", "#097", "#0A4", "#0D1", "#4F1", "#7C0", "#FF0", "#F80", "#F8F", "#F4A", "#F00"])
bounds = [23, 28, 33, 37, 40, 42, 45, 47, 49, 50, 51, 52, 53]
norm = BoundaryNorm(bounds, cmap.N)
bounds1 = [1, 2, 4, 8, 12, 16, 24, 32, 40, 48, 58, 64, 80]
norm1 = BoundaryNorm(bounds1, cmap.N)
# create the plot
fig = plt.figure(figsize=(5, 10))
ax1 = fig.add_subplot(311)
ax1.set_aspect('equal', 'box')
display = pyart.graph.RadarDisplay(radar)
display.plot('corrected_reflectivity_horizontal', 0, ax=ax1,
vmin=min(bounds), vmax=max(bounds), cmap=cmap, norm=norm, ticks=bounds,
colorbar_label='', axislabels=('','North South distance from radar (km)'))
ax2 = fig.add_subplot(312)
ax2.set_aspect('equal', 'box')
display.plot('RZC', 0, ax=ax2,
vmin=min(bounds1), vmax=max(bounds1), cmap=cmap, norm=norm1, ticks=bounds1,
colorbar_label='', title='R(Zc)', axislabels=('','North South distance from radar (km)'))
ax3 = fig.add_subplot(313)
ax3.set_aspect('equal', 'box')
display = pyart.graph.RadarDisplay(radar)
display.plot('RKDP', 0, ax=ax3,
vmin=min(bounds1), vmax=max(bounds1), cmap=cmap, norm=norm1, ticks=bounds1,
colorbar_label='', title='R(KDP)')
plt.suptitle('Zc vs. R(Zc) vs. R(KDP)', fontsize=16)
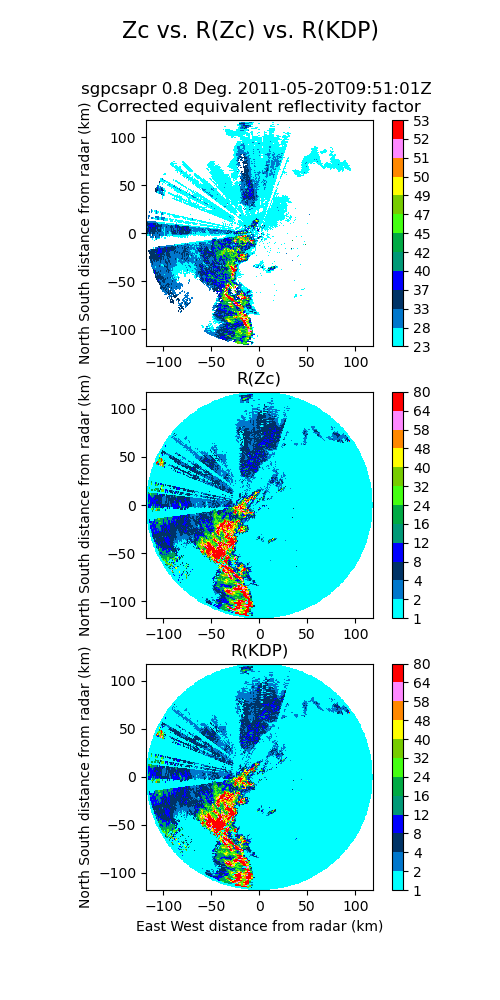
plt.show()図は、上から降雨減衰補正済の反射強度 (dBZ)、 (mm/hr) (mm/hr) をそれぞれ示す。 と の図を見比べると、ほぼ同じような分布となっている。仮に、 で反射強度に対して降雨減衰補正をしなかった場合は、もう少し値が下がると考えられる。上記で得られた降水強度の妥当性は、最終的には地上雨量計との比較が必要であろう。

おわりに
二重偏波レーダー変数の算出・補正について、Py-ART を用いつつ具体例を示した。二重偏波レーダーでは、レーダー変数が独立変数ではなく他の変数と関連しているため、それらの処理を遡って把握する必要がある。ひとたび処理の過程を把握し適切な補正済データが得られたならば、そのデータを用い新たな知見の創出が可能となるであろう。そのためにも二重偏波レーダーは事前の準備がとても大切なのである。
参考文献
- Adachi et al., 2015: Estimation of Raindrop Size Distribution and Rainfall Rate from Polarimetric Radar Measurements at Attenuating Frequency Based on the Self-Consistency Principle. Journal of the Meteorological Society of Japan, 93A, 359–388.
- Bringi, V. N. and V. Chandrasekar, 2001: Polarimetric Doppler Weather Radar: Principles and Applications. Cambridge University Press, 636 pp.
- Gu et al., 2011: Polarimetric Attenuation Correction in Heavy Rain at C Band, Journal of Applied Meteorology and Climatology, 50, 39–58.
- Rauber, R. M. and S. W. Nesbitt, 2018: Radar Meteorology: A First Course. Wiley-Blackwell, 488 pp.
- Ryzhkov, A. V. and D. S. Zrnic, 2019: Radar Polarimetry for Weather Observations. Springer, 742 pp.
更新履歴
- 2021-08-28: 初稿
- 2021-09-09: 誤字を修正
Miscellaneous — Aug 28, 2021
Made with ❤ and at Japan.